Sampling Defined
Sampling is analyzing a subset of all data in order to uncover truth about the larger data set. If the subset is too small – or is not representative of the whole – it can lead to very inaccurate data, and more importantly making bad decisions based on inaccurate data. It is important to understand how & when sampling is in effect in Google Analytics.
Default reports are not sampled in the free Google Analytics product. They are populated using data that has been processed to aggregate related dimensions and metrics (i.e., “aggregate tables”).
However, adding a secondary dimension, advanced segment, or creating a custom report, may require a set of dimensions and metrics that are not available in aggregate tables. This report request is considered an ad-hoc query that is subject to sampling if the number of sessions for the date range selected exceeds the threshold for your property type.
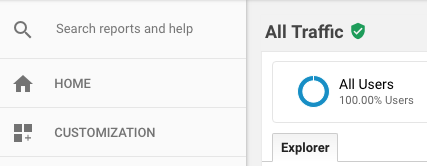
A report is sampled, or row limits are imposed, if the indicator icon next to the title of the report is yellow. When the indicator is green, the report has not been sampled. Mousing over the icon provides detail.
Row Limits
Row limits is another limitation of the free Google Analytics product. Row limits are separate from sampling thresholds, and apply to the maximum number of unique rows in a report. Row limits are not related to the number of sessions or conversions. A report can be impacted by sampling thresholds but not row limits, and vice-versa.
In Google Analytics reports, each row is a dimension value. Some reports contain dimensions that have a ton of different values. The number of different values a dimension can have is called “cardinality”.
Dimensions with many different values are referred to as high-cardinality dimensions. The “Page” dimension is a good example of a high-cardinality dimension. On the other hand, a dimension such as “Device Category” is a low-cardinality dimension given that there are only three possible values: desktop, mobile, and tablet.
When row limits are in effect you’ll see a row containing data labeled as “(other)”, or a warning that mentions a high-cardinality dimension.
How can you combat sampling and row limits?
When you require a complete and unsampled dataset for customized reporting that exceeds the sampling threshold, you can benefit from Unsampled Reports and Custom Tables – both features of Google Analytics 360.
Google Analytics data limits
This table summarizes the different limits within standard Google Analytics, Analytics 360, and these two Analytics 360 features: Unsampled Reports and Custom Tables.
| Limit Type | Standard Google Analytics | Analytics 360 | Unsampled Reports (360) | Custom Tables (360) |
|---|---|---|---|---|
| Default report sampling | None | None | n/a | n/a |
| Ad-hoc query sampling | Starts at over 500k sessions (property level) | Starts at over 100M sessions (view level) | None | None (from when it is created moving forward, with 30 day historical lookback) |
| Single Day Row Limit | 50k rows | 75k rows (except All Pages Report, which is 1M rows) | No limit | 1M rows |
| Multi-Day Row Limit | 100k rows | 150k rows | No limit | No limit |
| Overall Report Row Limit | 1M rows | 1M rows | 3M rows | 1M rows |
Additional Sources:
https://analytics.google.com/analytics/academy/course/8/unit/1/lesson/4
https://support.google.com/analytics/answer/7652477