
In our post about GA4 thresholding and reporting identity, we noted there will be meaningful differences between reporting with BigQuery exported GA4 data compared to GA4 predefined reports & GA4 Explorations. Understanding those differences is important, but you also need to be aware of the differences in reporting within GA4 itself in predefined reports and explorations to interpret report data correctly.
GA4 predefined reports leverage pre-computed (aggregated) underlying data, facilitating quick loading reports. GA4 explorations consider all of your raw event and user-level data, driving more detailed results.
Often reports & explorations will present the same data. However, there will be times when you observe differences in report data for these two distinct data presentation options.
Specific reasons for data differences between GA4 explorations and reports
- Different fields are supported. If you open a report in explorations (i.e., in a given report click the edit comparisons icon, and in the bottom right corner click the “Explore” button) some dimensions or metrics may not be supported and would simply not be presented in the exploration.
- Exploration “segments” are different than report “comparisons“. If you open a report with a comparison applied in explorations, an exploration segment is created from the comparison. However, any dimensions or metrics in that comparison that are not supported in explorations would simply be dropped.
- Data retention settings limit exploration date ranges, but not reports. If your GA4 standard exploration is limited to the max of 14 months, that’s as far back as your exploration can go with a date range. And, if you change from a retention setting of, for example, 2 months to 14 months – related data will only start being available in explorations from that point forward (i.e., you won’t see the full 14 months date range available in explorations right away).
- Exploration raw data queries are limited to 10M events in standard GA4, and 1B events in GA4 360. Exceeding these limits will result in sampling in your explorations.
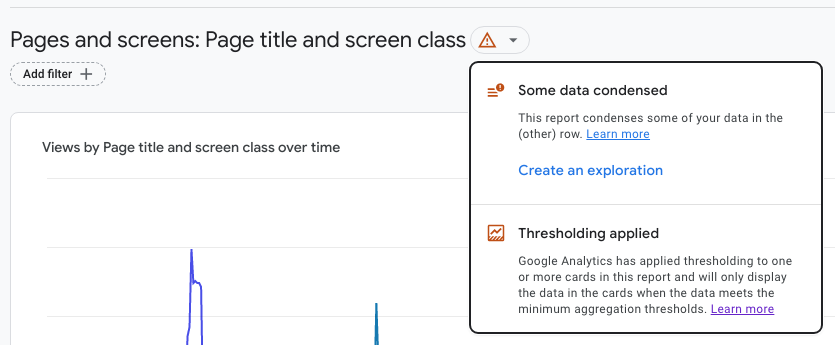
- Report aggregate data is subject to being grouped under an (other) row if you are recording high-cardinality dimensions (e.g., a user ID is registered as a custom dimension and is added as a secondary dimension to a predefined report).
- Behavioral modeling, when in effect, is applied in a slightly different manner in aggregated data vs. raw data, and can result in slight differences.
- Differences in data processing for reports vs. explorations can also impact report data collected in the last 48 hours.
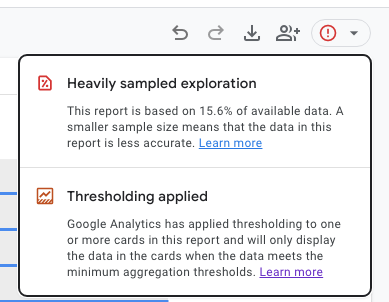
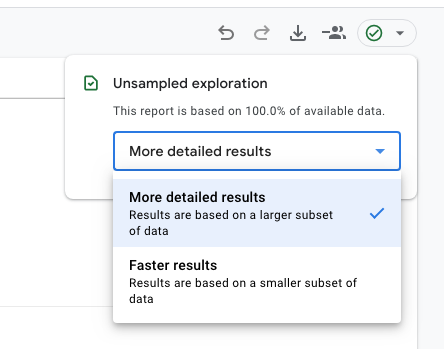
In general, explorations tend to be more accurate as they are based on raw data. But, as noted, exploration sampling can be in effect if enough of that raw data is processed in a query. To see the current exploration sampling rate, hover over the data-quality icon in the upper right of your explorations.
Exploration sampling, and report (other row) occurrences, in GA4
The sampling and (other) row occurrences we inventoried in Universal Analytics also happen in GA4. However, given the differences in the data they leverage to report, sampling only applies to GA4 Explorations, whereas (other) row occurs in GA4 predefined reports. The only tactic to eliminate sampling in GA4 standard explorations is to shorten the date range. In “GA4 360 license benefits” below we detail additional tactics to address exploration sampling available with GA4 360.
To avoid predefined report (other) row instances in GA4 standard:
- Use predefined dimensions before creating custom dimensions, and refrain from collecting dimensions with 500 or more different values (i.e., high cardinality dimensions) unless absolutely necessary.
- Use standard reports to leverage the aggregate data they report upon.
- If a standard report shows an (other) row, create an exploration from it to see if reporting on raw data eliminates it without sampling in effect.
- If you see sampling in an exploration created form a report with (other) row instances, you can eliminate them by reporting with BigQuery exported GA4 data (note there will be meaningful differences compared to GA4 predefined reports & GA4 Explorations).
GA4 data reported in Looker Studio
You can connect GA4 data to Looker Studio for reporting as well. This scenario is also subject to sampling, thresholding, as well as GA4 quotas (which are absurdly low – see below how GA4 360 helps address the lower Looker Studio quota limits in GA4 standard). However, using GA4 as a data source in Looker Studio:
- Is easier than reporting on GA4 data exported to BigQuery.
- Includes Google Signals impact joining distinct sessions for the same user together across devices.
- Includes data-driven attribution for conversions.
- Includes some demographics.
- Includes any modeled data for your GA4 property.
GA4 data in Looker Studio can be less transparent due to what can seem like arbitrary thresholding, as well as other unique count approximations employed by GA4 reporting (e.g., things like HyperLogLog++, or HLL+, which is used to estimate cardinality, and can make for indeterminate GA4 funnel explorations as well).
GA4 360 license benefits
GA4 360 enabled properties benefit over standard properties per the table of features below that are related to the topics in this post. Tactics available in GA4 360 to address exploration sampling include:
- Request an unsampled exploration.
- Adjusting the level of precision and speed in your explorations.
Tactics available in GA4 360 to address report (other) row occurrences include:
| Feature | Google Analytics 4 properties (standard) | Google Analytics 4 properties under Analytics 360 |
|---|---|---|
| Explorations | 200 created per user per property 500 shared per property | 200 created per user per property 1000 shared per property |
| Explore sampling limits | 10M events per query | 1B events per query |
| Unsampled explorations | Not available | Unsampled results up to 50B events per day per property |
| API quotas Most requests consume fewer than 10 tokens. | 25,000 tokens per day | 250,000 tokens per day |
| Data retention | Up to 14 months Options: 2, 14 months | Up to 50 months Options: 2, 14, 26, 38, and 50 months XL properties: 2 months |
| BigQuery Export | Daily export: 1 M events Streaming export: unlimited | Daily export: Billions of events Streaming export: unlimited |
Takeaways
- GA4 explorations and reports leverage different data in reporting that can drive presentation of different results.
- GA4 explorations and reports support different dimensions & metrics.
- Data retention, sampling, and (other) row occurrences can also drive differences in resultant GA4 exploration and report data.
- Sampling impacts explorations, and (other) row occurrences impact reports.
- GA4 Standard data connected directly to Looker Studio is also subject to sampling, thresholding and quotas.
- GA4 360 licenses offer additional tactics to address exploration sampling & report (other) row occurrences, as well as higher Looker Studio API quotas.